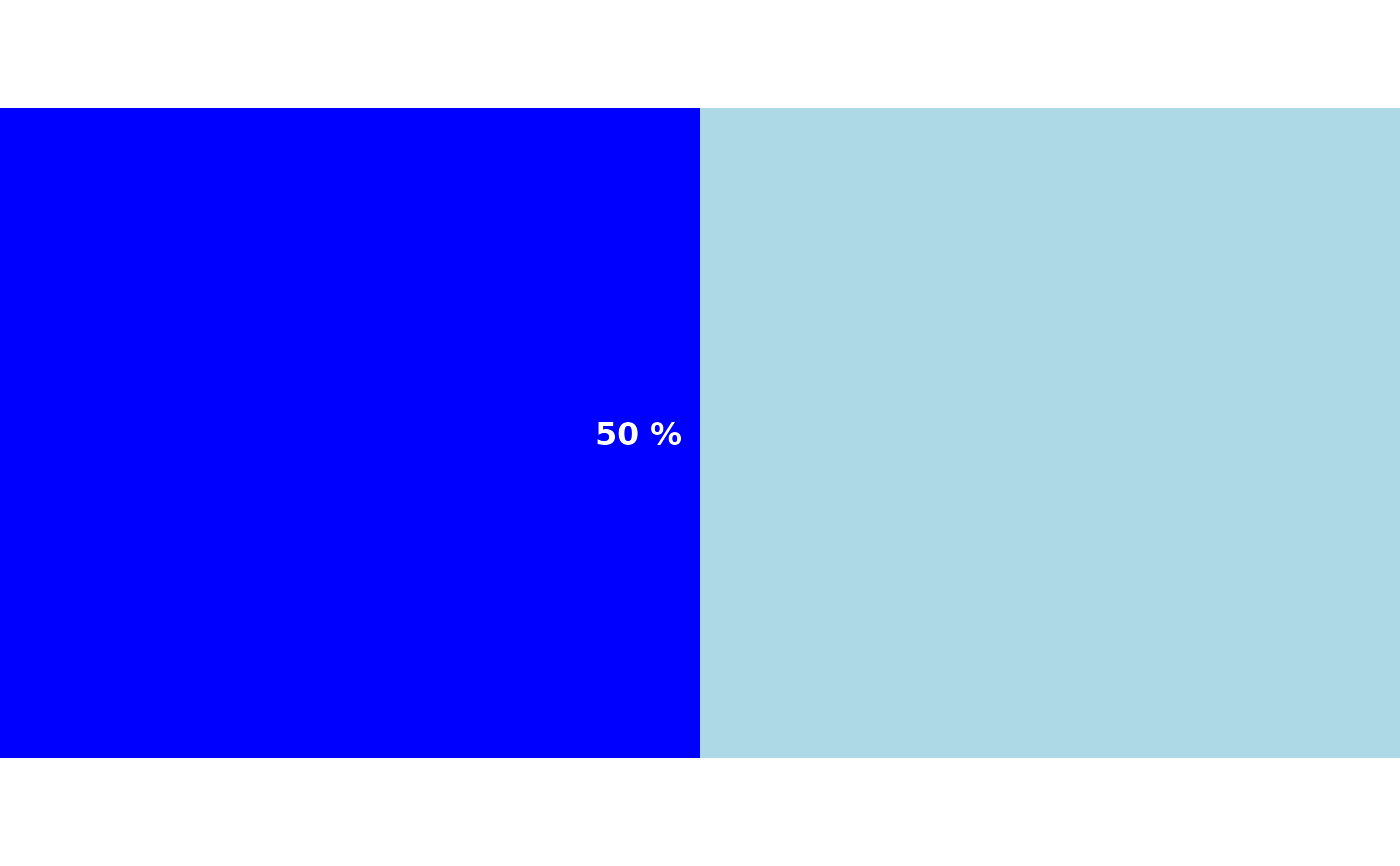
Creates a horizontal bar plot representing a single proportion, with optional formatting and colors.
Usage
proportion_bar(
  proportion,
  format = fmt_percent(),
  fgcol = "maroon",
  bgcol = "grey90",
  textcol = "black",
  textcol_inverted = "white",
  proportion_inversion_point = 0.5,
  size = NA
)
Arguments
- proportion
Numeric value between 0 and 1 representing the proportion to be plotted.
- format
Function to format the proportion label. Defaults to
fmt_percent(). Most common alternative is to usefmt_round().- fgcol
Color for the foreground (proportion) part of the bar. Defaults to
"maroon".- bgcol
Color for the background (remaining) part of the bar. Defaults to
"grey90".- textcol
Colour of proportion label when
proportionis less thanproportion_inversion_point- textcol_inverted
Colour of proportion label when
proportiongreater thanproportion_inversion_point- proportion_inversion_point
The proportion above which the proportion will be rendered on top of progress bar, not
- size
Numeric value for the text size of the proportion label. Defaults to
NA.