Visualize Bootstrap Contributions for Signatures
Source:R/sig_visualise_bootstraps.R
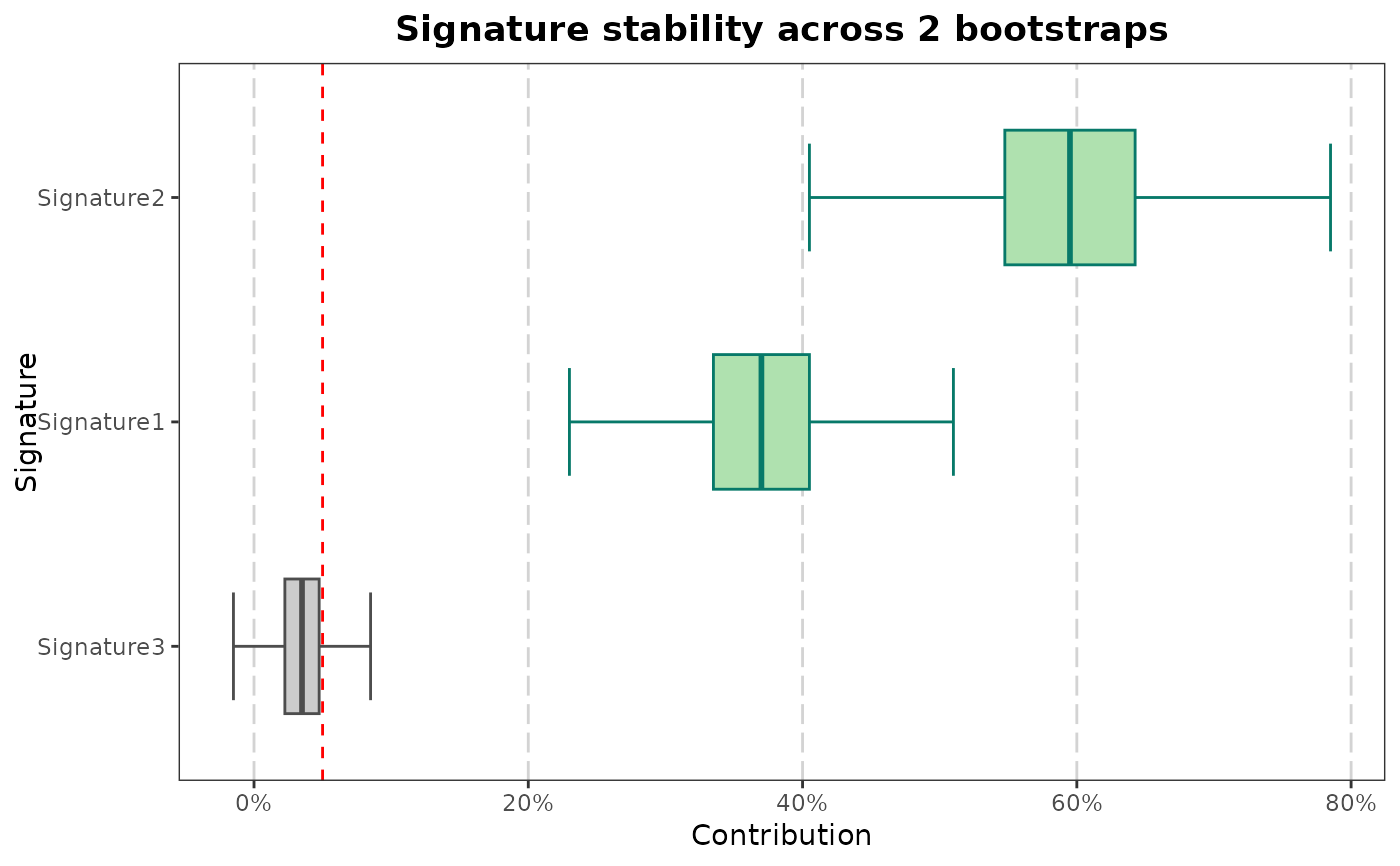
sig_visualise_bootstraps.RdThis function takes a dataframe of bootstrap contributions for signatures and visualizes them using boxplots. It highlights significant contributions based on a p-value threshold and a minimum contribution threshold.
Usage
sig_visualise_bootstraps(
  bootstraps,
  min_contribution_threshold = 0.05,
  pvalue = 0.05,
  horizontal = FALSE,
  width = 0.6,
  staplewidth = 0.8,
  title = TRUE,
  ...
)
Arguments
- bootstraps
A dataframe in sigverse style describing bootstraps. See
sigshared::example_bootstraps().- min_contribution_threshold
Numeric value representing the minimum contribution threshold to consider (default is 0.05). See threshold argument of
sigstats::sig_compute_experimental_p_value().- pvalue
The p-value threshold for significance (default is 0.05). P values are computed using
sigstats::sig_compute_experimental_p_value()- horizontal
flip the coordinates so that signatures are on the X axis and contributions are on the Y axis.
- width
Width of the boxplots (value between 0 and 1).
- staplewidth
The relative width of staples to the width of the box. Staples mark the ends of the whiskers with a line.
- title
should a plot title be shown? (flag)
- ...
Arguments passed on to
boxplotstats::plot_boxplot_statsstatsA dataframe containing boxplot statistics with required columns: 'outlier_low_threshold', 'outlier_high_threshold', 'median', 'q1', 'q3', and 'outliers'.
xlabA character string specifying the x-axis label. Default is "Value".
ylabA character string specifying the y-axis label. Default is "ID".
delimThe delimiter used in the 'outliers' column for splitting string-based outliers into numeric values. Default is "|".
sortLogical, whether to sort boxplots by the 'median' column. Default is TRUE.
descendingLogical, if sorting, whether to sort in descending order. Default is TRUE.
col_fillOptional column name for determining the fill color of the boxplot.
col_colourOptional column name for determining the outline color of the boxplot.
col_tooltipOptional column name for custom tooltips in the interactive plot. Default is a generated tooltip.
col_data_idOptional column name for the
data_idused in interactivity.col_onclickOptional column name for specifying the
onclickactions in the interactive plot.show_legendLogical, whether to show the legend for color and fill. Default is TRUE.
dotsizeSize of outlier points. Default is 1.
dotstrokeStroke width of outlier points. Default is 1.
dotshapeShape of outlier points. Default is 1.
linewidthWidth of the boxplot outlines. Default is 0.5.
Examples
library(sigshared)
sig_visualise_bootstraps(example_bootstraps())