Visualize Proportions as a Donut Plot
Usage
sig_visualise_donut(
  proportions,
  unexplained_label = "Unexplained",
  inner_radius = 0.6,
  palette = NULL,
  guide_title = NULL
)
Arguments
- proportions
A named numeric vector where the values represent proportions, and names represent labels.
- unexplained_label
Label for the remaining proportion if proportions sum to less than 1. Defaults to "Unexplained".
- inner_radius
Radius of the hole in the center of the donut (0 to 1 scale).
- palette
A named character vector where the names match the
proportionsvector andunexplained_label, and values are colors.- guide_title
The legend's title. Set to
NULLfor no title.
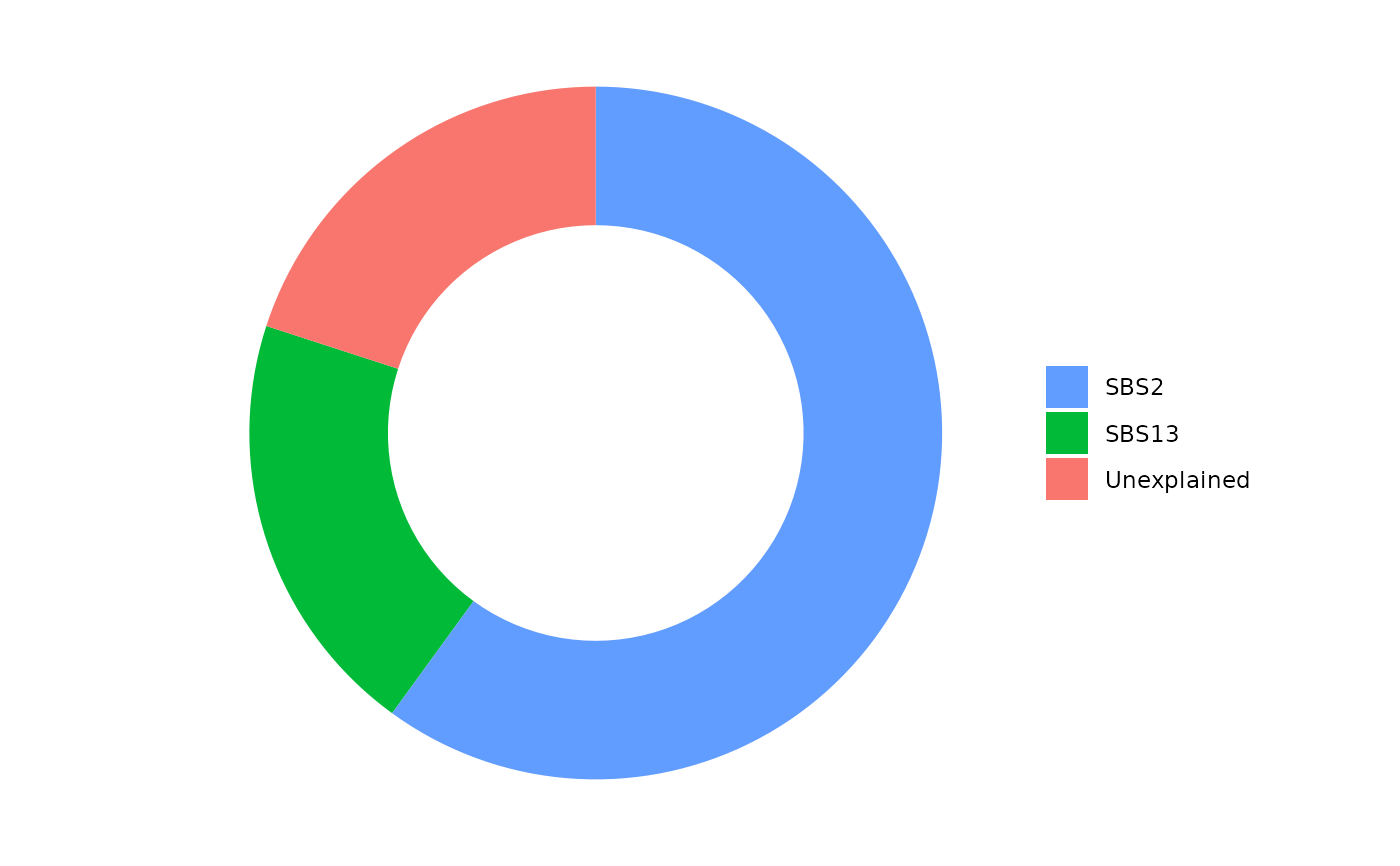
Examples
model = c('SBS2' = 0.6, 'SBS13' = 0.2)
sig_visualise_donut(model)